Flow Genome
ORDR SCE possesses an in-depth understanding of the fixed characteristics of each device within your network and the constantly evolving and heterogeneous context in which these devices operate. Leveraging this knowledge, ORDR SCE classifies each device and establishes baselines for its dynamic behavior, considering the specific context of your network. This comprehensive approach enables ORDR SCE to detect even the most subtle behavioral changes that could indicate a potential breach or compromise of security.
Through mapping the flow genome, ORDR SCE automatically captures and analyzes extensive amounts of information about each device in your network without requiring any modifications to the devices themselves or your existing enterprise infrastructure. This automated mapping process provides a holistic view of every device's flow characteristics and behavior, empowering you to safeguard all assets within your enterprise proactively. The flow genome represents the learned behavior patterns of your endpoints and device profiles. It serves as the foundation for establishing baselines that define what is considered normal and safe behavior for each device. By comparing the real-time behavior of devices against their established flow genome, ORDR SCE can identify anomalies and deviations from expected behavior. These anomalies may indicate potential security threats or breaches.
The mapping of the flow genome facilitates the identification of anomalies and potential security breaches and provides valuable insights for optimizing network performance and resource allocation. By closely monitoring and analyzing the flow genome, administrators can gain deeper insights into network behavior patterns, identify potential bottlenecks or inefficiencies, and make informed decisions to enhance overall network efficiency and user experience.
Flow Genome Panel
The Flow Genome in ORDR SCE offers a comprehensive and visually informative graphic display of network activity associated with a specific device. Users can access it by clicking on the Flow Genome ![]() icon. The Flow Genome serves several purposes:
icon. The Flow Genome serves several purposes:
- Baseline Behavior Visualization: The Flow Genome shows whether a device operates within its established baseline behavior or if there are deviations. Color coding indicates anomalous traffic, allowing users to spot abnormal activity quickly.
- Intuitive Flow Analysis: The Flow Genome's unique helix design helps users identify problematic flows and prioritize further investigation. Lower-risk flows are displayed further down the helix. Users can click on individual helix steps to view detailed information about each flow.
- Interactive Exploration: Users can click on flows of interest within the Flow Genome to access other data panels. These panels provide additional information, allowing users to gain deeper insights and potentially take appropriate actions based on their findings.
The accompanying image provides an example of the Flow Genome panel. The top of the display prominently shows the name and IP address of the selected device. The region below presents all the data related to traffic originating from or terminating at the device, offering a comprehensive overview of its network activity.
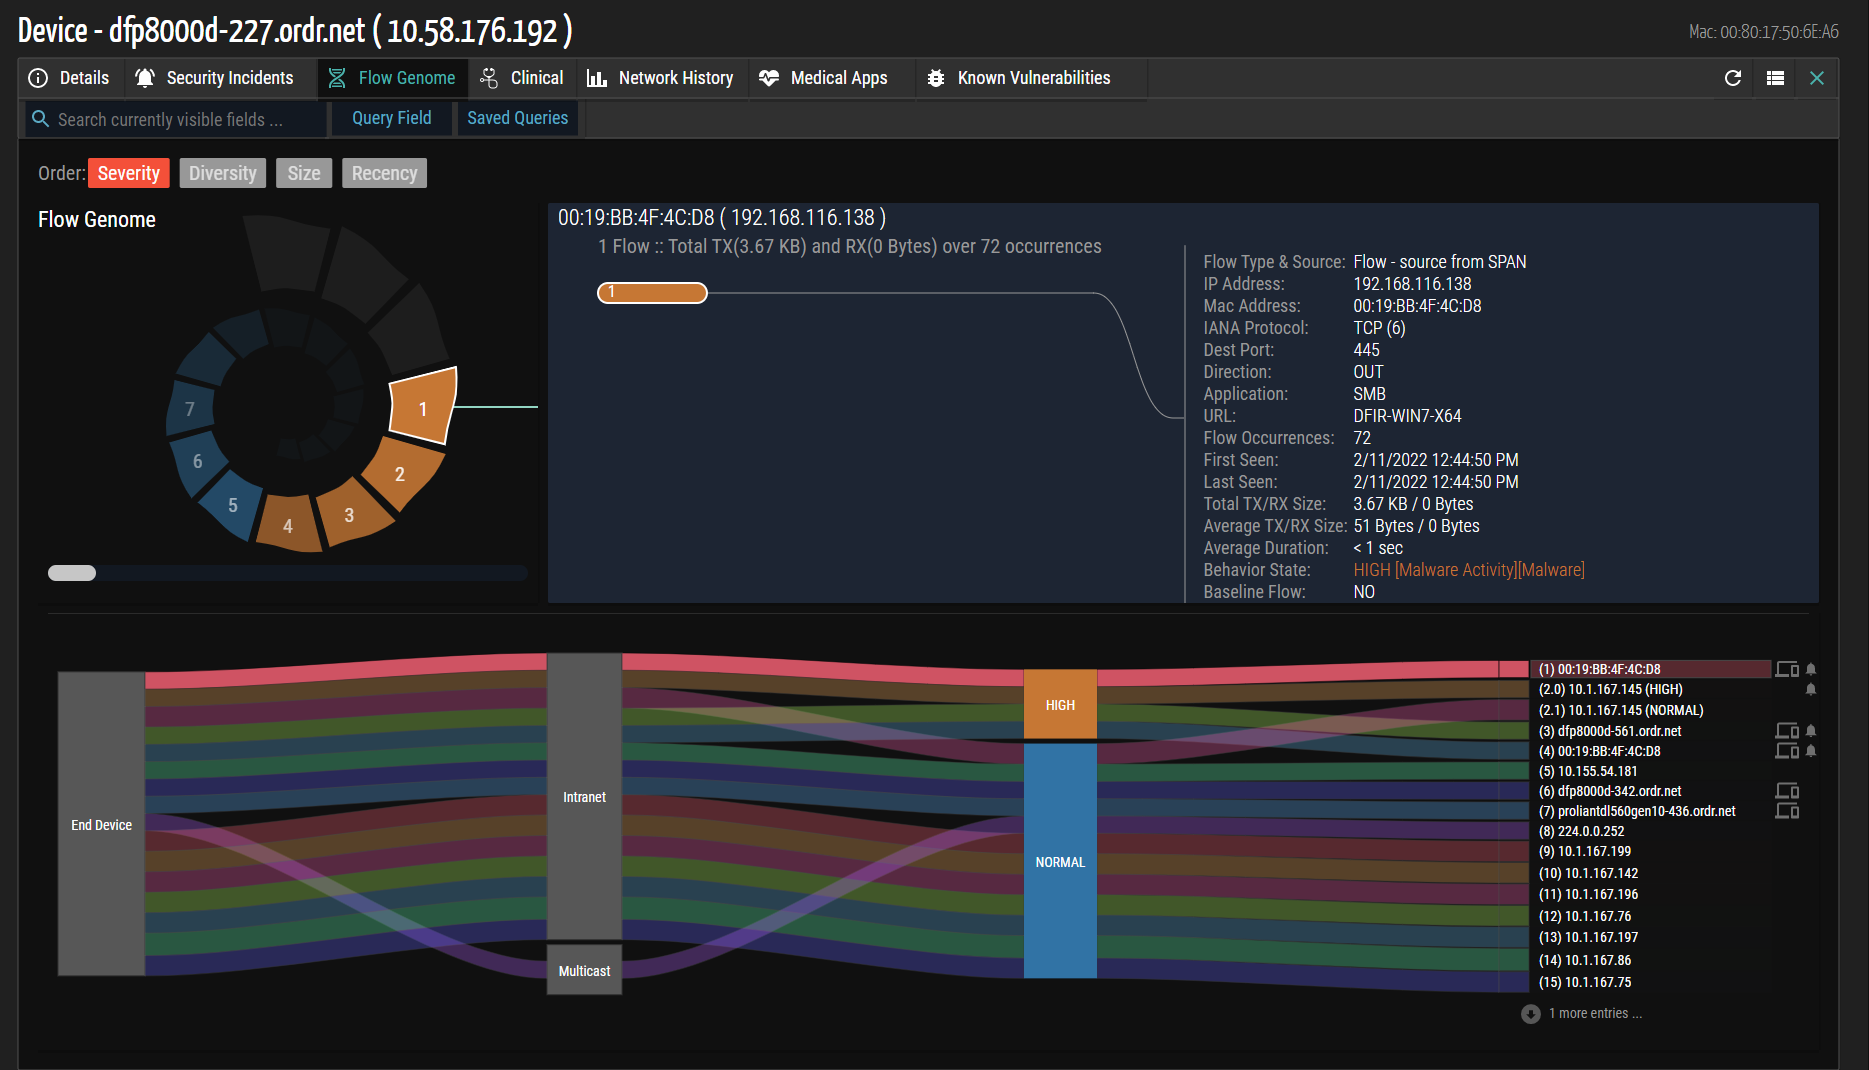
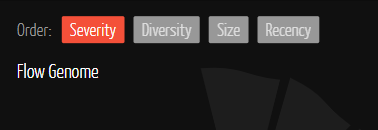
The sorting options determine the order of the steps in the Genome. Each step in the Genome represents a different endpoint with which the device communicates. The available options are as follows:
- Severity - The system assigns security severity scores to endpoints, displaying those with higher scores first. This option is selected by default when the Genome is first displayed.
- Diversity - Endpoints involving more separate ports and protocols are listed higher in the spiral. For example, an endpoint connecting through SNMP and SSH (two protocols) will be listed higher than an endpoint using only HTTP (one protocol).
- Size - Endpoints with larger traffic volumes are displayed first.
- Recency - Endpoints with the most recently occurring traffic are displayed first.
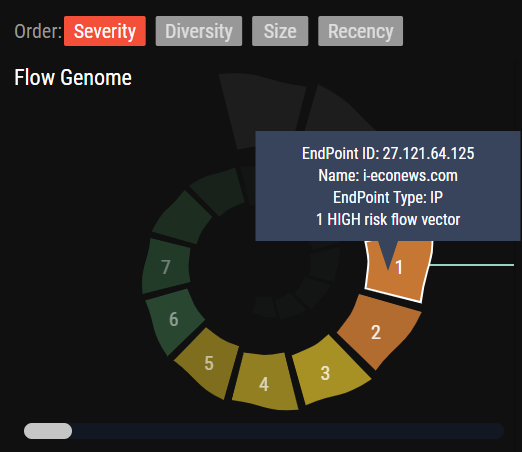
Helical Graph
The helical graph serves as a visual representation of communication peers, where each wedge or step represents a distinct peer. Users can easily click on a wedge to access and view all the flows associated with that particular peer. This provides comprehensive information, including time, port, protocol, application, session, packet, and byte TX/RX counts. The flows are color-coded based on their security risk ratings, making identifying and assessing them quickly easy.
The helical graph includes a dynamic rotation feature. When activated, the spiral graph automatically rotates to display the segment located at the right-most part of the display. This ensures users have a clear and focused view of the segment they wish to analyze. Users can manually rotate the spiral using the control slider below the helical graph. Users can adjust the display according to their preferences and specific analytical needs by clicking and dragging the slider.
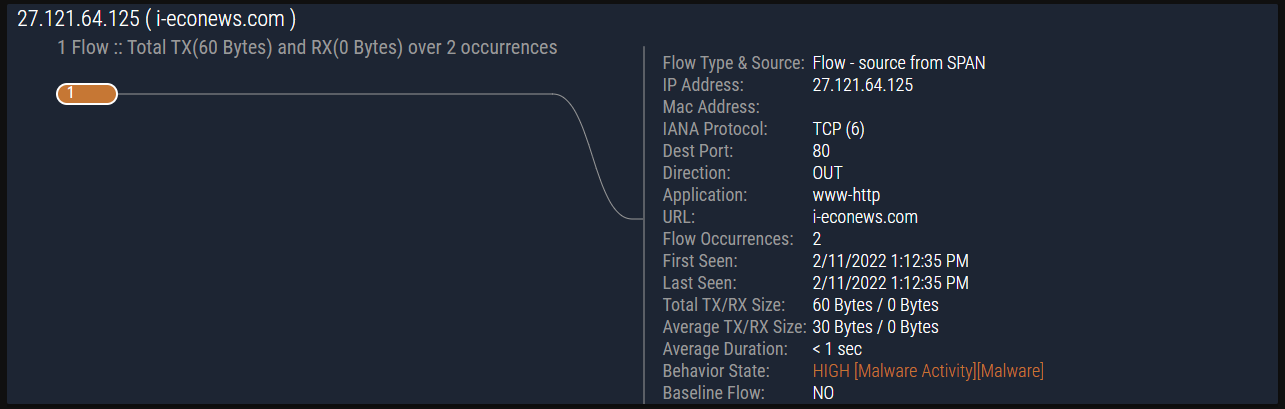
Flow Detail Chart
The Flow Detail chart serves as a dynamic and informative tool that provides detailed information about network flows based on the selected flow category within the Flow Genome. Whenever a flow category is chosen, the Flow Detail chart updates and displays all the flows. This ensures users can access accurate and relevant information based on their selected flow criteria.
In the Flow Detail chart, flows are visually represented by numbered badges. These badges act as clickable points that allow users to select and focus on specific flows of interest. When a badge is clicked, detailed information about the selected flow instantly appears in a designated section on the right side of the chart. This feature gives users a comprehensive understanding of the flow's characteristics, behavior, and associated data. The badges in the Flow Detail chart are color-coded to represent different levels of security threats or other anomalies. This color scheme gives users a quick visual indication of the severity or significance of each flow. For example, certain colors may indicate high-risk flows that pose potential security threats, while others may signify flows with unusual patterns or abnormal behavior. This enables users to prioritize their focus and quickly identify flows that require further investigation or remediation.
By utilizing the Flow Detail chart, network administrators can gain deep insights into the nature and attributes of individual flows within the network. This information is invaluable for identifying potential security vulnerabilities, detecting abnormal network behavior, and making informed decisions regarding network optimization and threat mitigation.
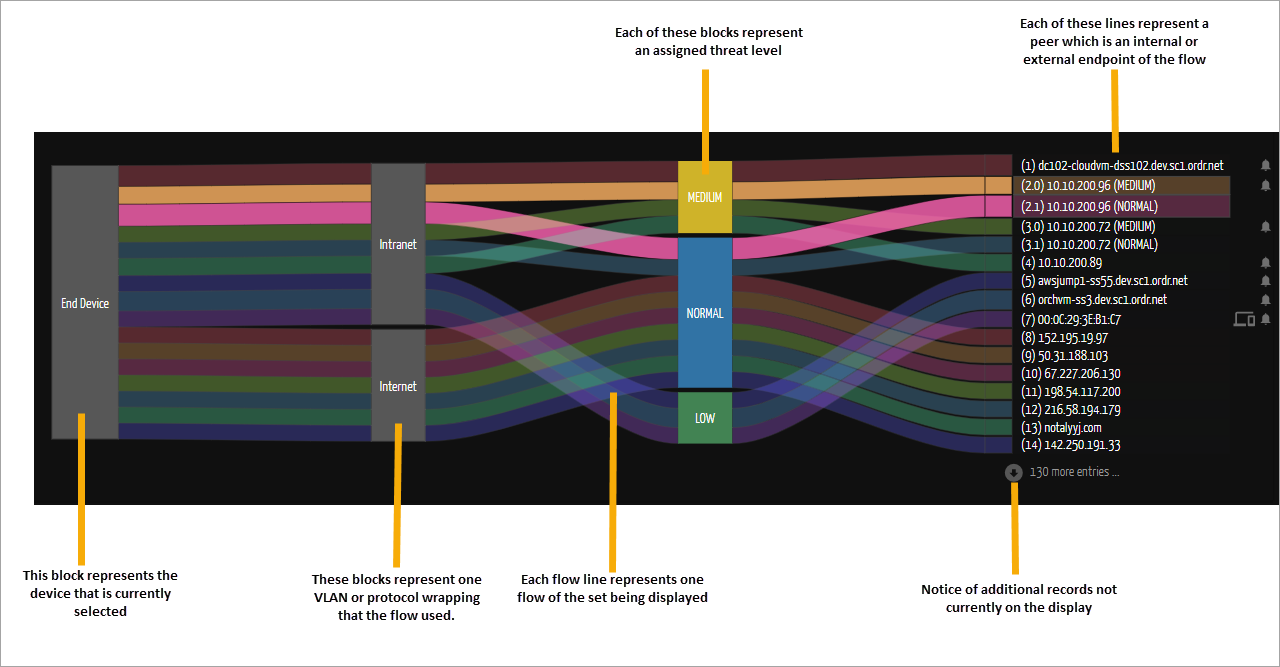
Flow Connection Graph
The Sanky diagram provides an alternative view of network information by categorizing peers on the right side as Internal or External. Device details within ORDR are linked to internal peers, while geolocation information is linked to external peers. Flows between devices are represented using colored ribbons in the diagram to provide a clear visual representation of flows, allowing easy tracing from the originating device on the left to the corresponding peer device on the right, enabling them to pinpoint potential bottlenecks, anomalies, or areas of interest within the network.
To improve usability, each flowline on the right-hand side of the diagram includes a clickable label. Clicking on this label adjusts the Flow Genome display, focusing on the specific flow and providing a more detailed view and analysis of its characteristics. This functionality allows users to gain deeper insights into the behavior and attributes of the flow within the network. By utilizing the Sanky diagram, network administrators and analysts can visually depict the relationships between devices, identify internal and external peers, and trace the data flow within the network. This visual representation offers a comprehensive and intuitive understanding of how devices communicate and interact with each other.
Baselining Device Communication
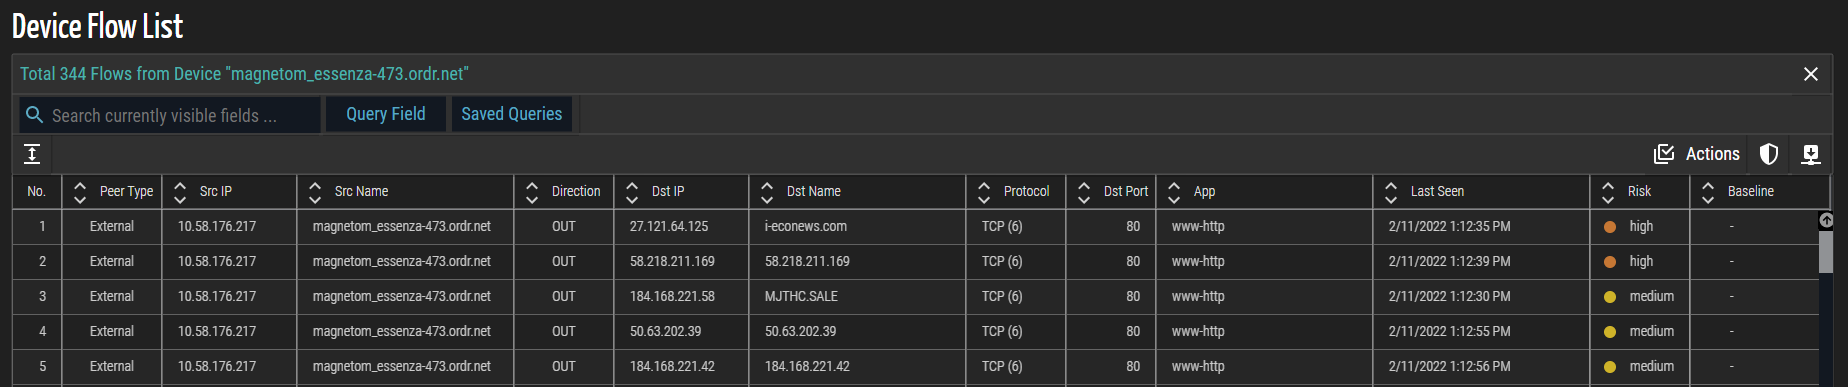
The Device Flow List window displays details about the flow of data over a single device. Administrators can add or remove flows to or from the baseline. When baselines are enforced, the SCE will alert administrators of all communications outside the established and approved communication pattern. ORDR SCE baselines normal communication behavior and translates that behavior into a device-specific security policy.
- Click the
 (View Flow List Panel) icon in the upper right corner of the Flow Genome panel to display the Flow List associated with this Flow Genome. The resulting list below represents all inbound and outbound communication peers, protocols, and ports to or from this profile's selected group of devices.
- Click the
 Actions icon in the upper right corner of the Device Flow List page.
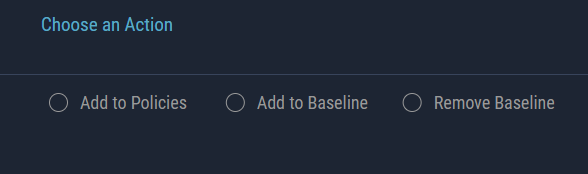
- Choose Add to Baseline action.
- Select the checkbox(es) next to the list of records to which you want to apply the action. The confirmation message is displayed.

- To add selected flows to a baseline, click Apply.
Policy Enforcement at Device Flow
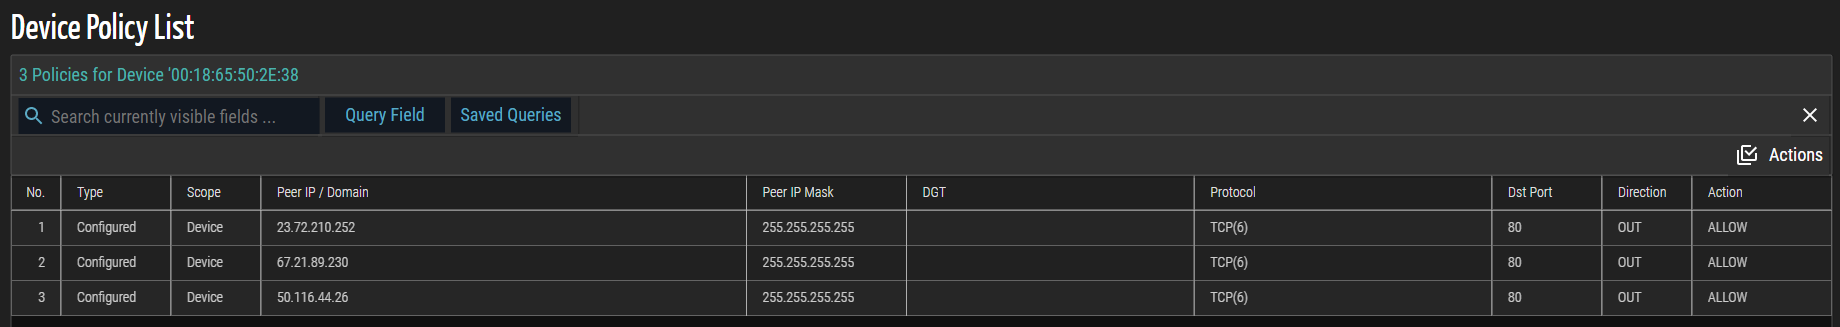
When a group-based policy is enforced through network access control (switch, wireless, firewall ACLs), segmentation (VLANs), or micro-segmentation (Group/Tag), the ORDR SCE generates the policy understood by the target enforcement system. Administrators can copy the policy for a manual update into the policy server or enforcement device, or else “push” policy through the native connectors available on the target system (for example, CLI, API, pxGrid, etc.).
- Click the (View Flow List Panel) icon in the upper right corner of the Flow Genome panel.
- Click the
 icon in the upper right corner of the Device Flow List page.
- Click the Actions icon in the upper right corner of the Device Flow List page.
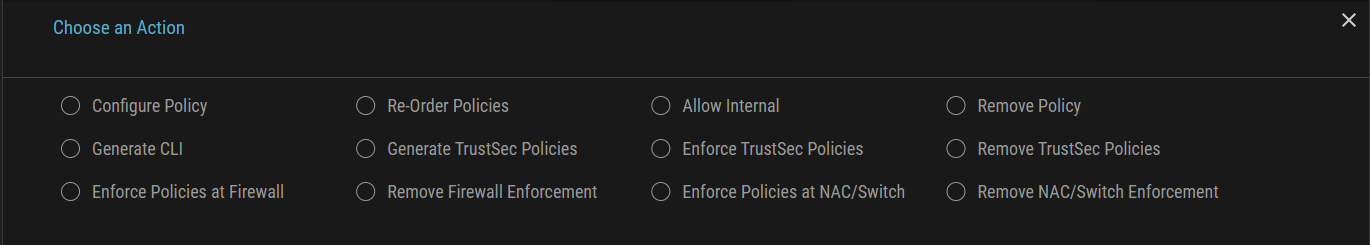
- Choose Enforce Policies at Firewall action.
- Select the checkbox(es) next to the list of records to which you want to apply the action. The confirmation message is displayed.
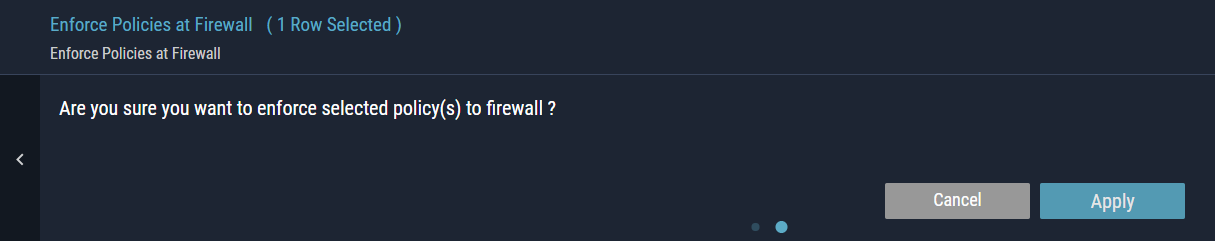
- To enforce selected policy(s) to the firewall, click Apply.
© 2026 ORDR. All Rights Reserved.